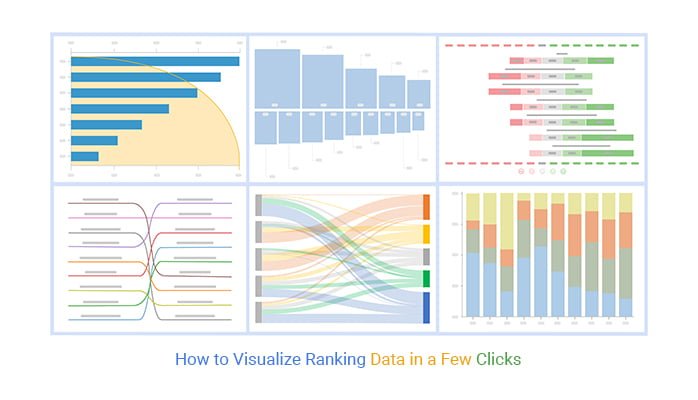
Data visualization is a powerful tool that allows us to understand complex data sets and communicate insights effectively. By presenting information in a visual format, we can easily identify patterns, trends, and outliers. However, creating meaningful visualizations requires careful consideration and asking the right questions. In this article, we will explore some of the most important data visualization questions that can help guide the creation of effective visualizations.
See these data visualization questions
- What is the main objective of the visualization?
- What data is available and how is it structured?
- What are the key variables and their relationships?
- What type of visualization will best represent the data?
- What is the target audience for the visualization?
- What level of detail is necessary to convey the message?
- How will the visualization be displayed or shared?
- What are the limitations or potential biases in the data?
- How will outliers or anomalies be handled in the visualization?
- What colors or visual cues will be used to represent different categories?
- What level of interactivity or drill-down capabilities are needed?
- How will the visualization be updated or maintained over time?
- What insights or actions should the visualization inspire?
- How will the visualization be integrated with other data or systems?
- What are the ethical considerations of the data visualization?
- What is the desired outcome or impact of the visualization?
- What are the potential risks or unintended consequences of the visualization?
- How will the visualization be validated or tested for accuracy?
- What is the timeframe or deadline for creating the visualization?
- What tools or software will be used to create the visualization?
- What are the best practices or guidelines for data visualization?
- How will the visualization be optimized for different devices or screen sizes?
- What is the budget or resources available for creating the visualization?
- What is the preferred language or narrative of the visualization?
- What are the current trends or innovations in data visualization?
- How will the visualization be evaluated or measured for success?
- What are the potential challenges or obstacles in creating the visualization?
- What are the industry or domain-specific considerations for the visualization?
- How will the visualization be documented or documented?
- What are the relevant data visualization standards or guidelines?
- What are the privacy or security implications of the visualization?
- How will the visualization be optimized for accessibility?
- What are the cultural or geographical considerations for the visualization?
- How will the visualization be integrated with other visualizations or dashboards?
- What are the data sources or data collection methods?
- What are the statistical or mathematical techniques used in the visualization?
- What are the potential biases or limitations in the visualization?
- How will the visualization be documented or documented?
- What are the relevant data visualization standards or guidelines?
- What are the privacy or security implications of the visualization?
- How will the visualization be optimized for accessibility?
- What are the cultural or geographical considerations for the visualization?
- How will the visualization be integrated with other visualizations or dashboards?
- What are the data sources or data collection methods?
- What are the statistical or mathematical techniques used in the visualization?
- What are the potential biases or limitations in the visualization?
By asking these data visualization questions, you can ensure that your visualizations are not only visually appealing but also informative and impactful. Remember, the goal of data visualization is to simplify complex information and tell a compelling story through visuals. So, take the time to think critically about your data and ask the right questions to create meaningful and effective visualizations.