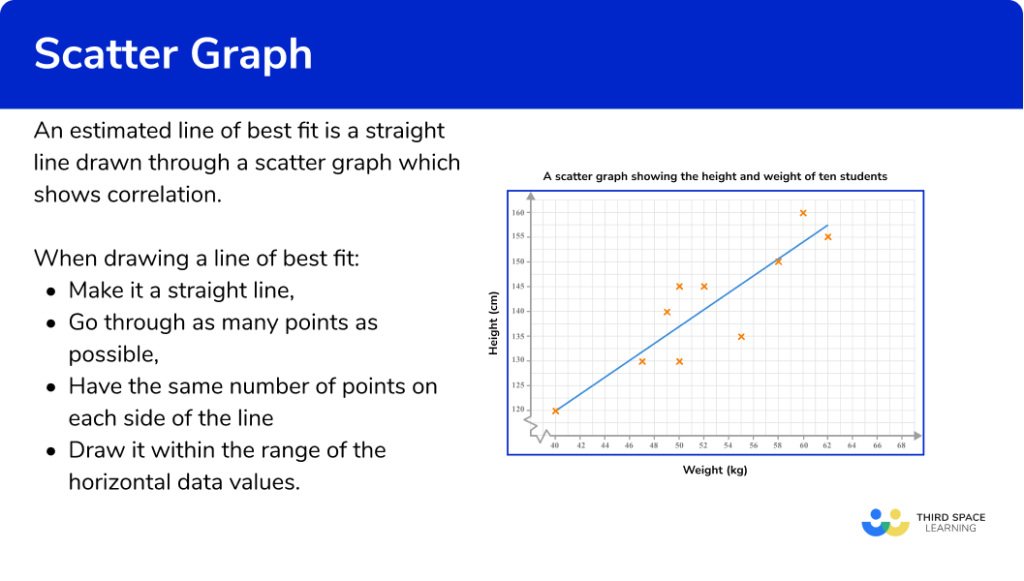
Scatterplots are a powerful tool in data visualization that allows us to examine the relationship between two variables. By plotting data points on a graph, we can identify patterns, trends, and outliers. However, knowing what questions to ask when analyzing a scatterplot is crucial in deriving meaningful insights from the data. In this article, we will explore the concept of scatterplot questions and provide a comprehensive list of examples to help you make the most out of your data analysis.
When analyzing a scatterplot, it’s important to ask the right questions to uncover valuable insights. These questions can help us understand the correlation, distribution, and outliers within the data. By asking targeted questions, we can gain a deeper understanding of the relationship between the variables and make informed decisions based on the findings.
Whether you are a data scientist, researcher, or just someone curious about data, asking scatterplot questions is an essential step in the data analysis process. By doing so, you can uncover hidden patterns, validate assumptions, and even discover new relationships that were not initially apparent.
See these scatterplot questions
- What is the overall trend between the two variables?
- Is there a positive or negative correlation between the variables?
- Are there any outliers in the data?
- Is there a linear relationship between the variables?
- Does the scatterplot show any clusters or groups?
- Are there any patterns or trends over time?
- Does the scatterplot suggest any causal relationship?
- Is there a clear relationship between the variables?
- Are there any data points that are far away from the general trend?
- Do the variables show any seasonal patterns?
- Are there any data points that are influential in determining the relationship?
- Is there a relationship between the variables for different subsets of the data?
- Are there any non-linear relationships between the variables?
- Does the scatterplot suggest any outliers that need further investigation?
- Is there a correlation between the variables for different categories?
- Are there any data points that need to be excluded due to errors or anomalies?
- Does the scatterplot support or contradict previous assumptions?
- Do the variables have a proportional relationship?
- Are there any patterns or clusters based on geographic location?
- Does the scatterplot show any heteroscedasticity?
- Is there a relationship between the variables across different time periods?
- Are there any data points that significantly affect the relationship?
- Does the scatterplot suggest any transformations to improve the relationship?
- Is there a relationship between the variables for different demographic groups?
- Are there any missing data points that need to be addressed?
- Does the scatterplot provide evidence for a hypothesis?
- Are there any seasonal patterns that repeat over multiple years?
- Is there a relationship between the variables for different regions?
- Are there any data points that need to be weighted differently?
- Does the scatterplot suggest any influential points that need to be investigated further?
- Is there a relationship between the variables for different age groups?
- Are there any data points that deviate significantly from the expected relationship?
- Does the scatterplot show any evidence of multicollinearity?
- Is there a relationship between the variables for different income levels?
- Are there any missing variables that may affect the relationship?
- Does the scatterplot suggest any interaction effects between the variables?
- Is there a relationship between the variables for different educational backgrounds?
- Are there any data points that need to be transformed to conform to assumptions?
- Does the scatterplot support or reject a specific hypothesis?
- Are there any patterns or trends based on gender?
- Is there a relationship between the variables for different industries?
- Are there any data points that have a significant impact on the relationship?
- Does the scatterplot suggest any potential outliers that need to be treated separately?
- Is there a relationship between the variables for different ethnicities?
- Are there any data points that violate any statistical assumptions?
Asking these scatterplot questions and exploring the answers can lead to valuable insights and better decision-making. Remember to adapt the questions to your specific dataset and research objectives. By harnessing the power of scatterplot analysis, you can unlock hidden patterns and relationships within your data.